
The research published in Earth’s Future showcases promising data-driven results. If implemented successfully, the project could generate up to four times the amount of energy produced in the United States annually. A green future is on the horizon, and is gaining speed every day, EcoNews says. That is a very optimistic reading of the current political situation in many places around the world, where demonizing “the other” is the latest blood sport. However, the need is urgent and anything that might get us out of the planet-destroying mess we are in today should at least be given consideration.
While the research may be hypothetical and data driven, the thinking-outside-the-box nature of the project is what the world is desperately needing more of, EcoNews says. To promote a radical shift from fossil fuelled energy to green energy, radical ideas need to be considered. As the world moves into the 5th industrial revolution, never before has technological innovation been as robust as it is today. Green energy innovation is at its peak and a global solar panel network is not a question of “maybe,” but one of “when.”
Innovative and radical solutions such as solar panels over global highways are ideas that are becoming increasingly more relevant as the world goes green. We already put solar panels over canals. The idea to put them over roads may seem weird, but doing nothing and letting average global temperatures soar by 3°C (5.4°F) is even weirder — and a death sentence for hundreds of millions of people. This idea may strike many readers as too far out, but is it any more far out than geoengineering that no one knows will work and will cost trillions of dollars to find out?
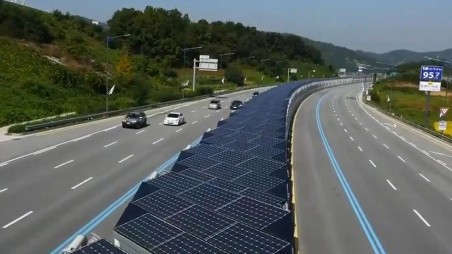
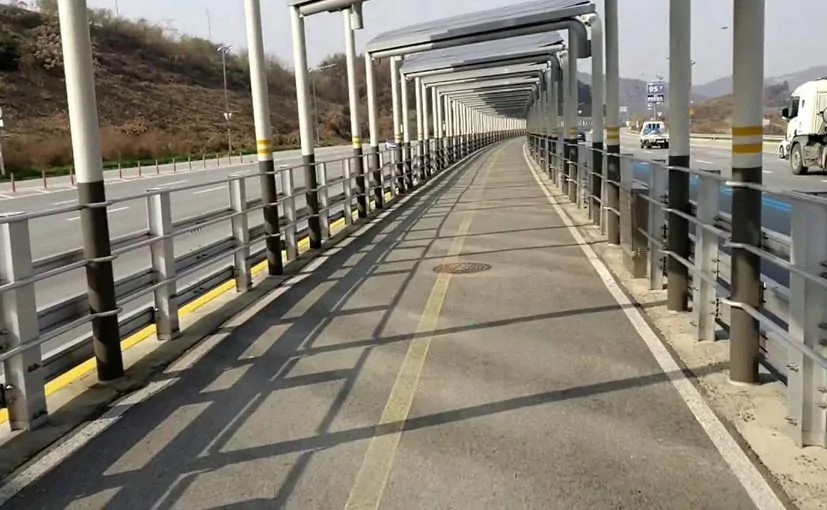
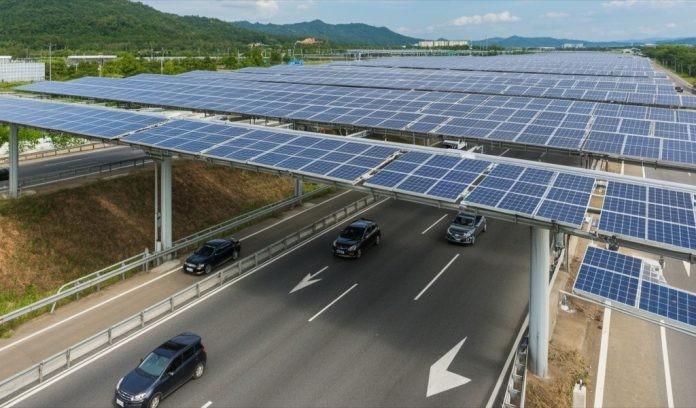
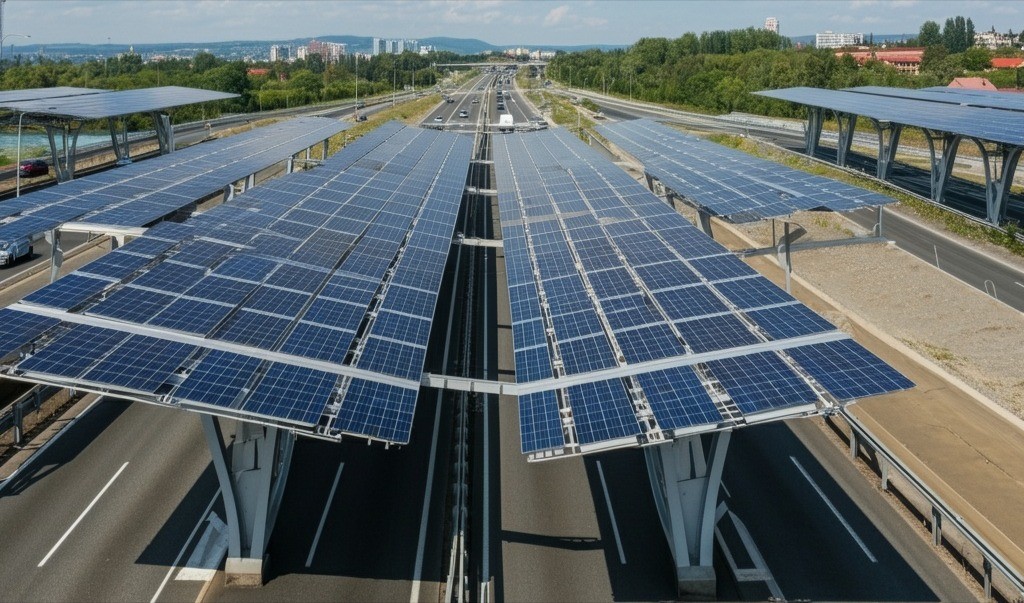
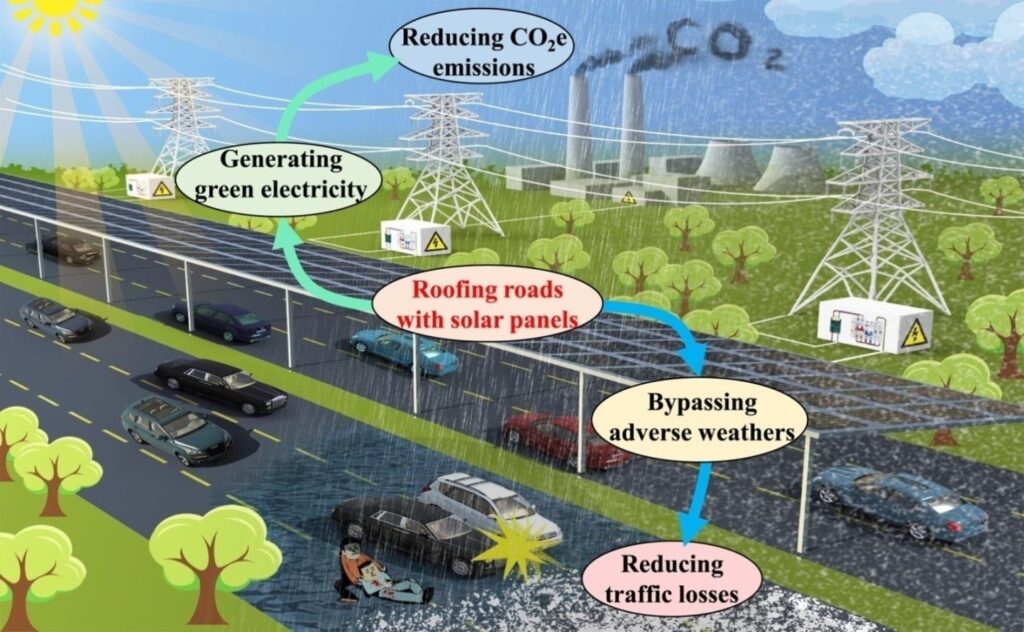
Several pilot projects of highway PV in China, the United States (US), Germany, Austria, and Switzerland have already demonstrated the technical feasibility of using PV to supply electricity for highway rest areas and tunnels (Enkhardt, 2020; Steven, 2016). These projects imply that the benefits of the highway PV mainly embody two aspects. First, highway PV can reduce carbon dioxide equivalent (CO2e) emissions by generating green electricity that can be delivered to the grid, thereby replacing electricity that would otherwise be generated by fossil fuel sources. The global highway network spans over 3.2 million kilometres on the Earth (Meijer et al., 2018). If the space above highways is entirely devoted to PV installations, considerable amounts of green electricity can be generated to offset carbon emissions, contributing to a net zero emissions future. Meanwhile, the use of already-developed highway surfaces is beneficial because this would not increase watersheds’ imperviousness and reduce previous lands’ disturbance.
Second, the unique advantage of highway PV over other ground-based PVs lies in the enormous reduction of road traffic losses. As the eighth leading cause of death worldwide (Foreman et al., 2018), road traffic accidents claim approximately 1.35 million lives and cause 50 million injuries each year (WHO, 2018). The social-economic burdens associated with these accidents are estimated to be about 2.7% of gross domestic product (GDP) in high-income countries and 2.2% of GDP in low- and middle-income countries (Wijnen & Stipdonk, 2016). The highway PV can protect cars from adverse weather conditions (e.g., rainy, snowy, and freezing), thereby reducing the incidence of road traffic accidents and the ensuing deaths and socio-economic burdens.
However, the two co-benefits of highway PV above have not been widely recognized, leading to underdeveloped highway PV. As a result, its role in accelerating energy transition and achieving SDGs has not yet been played. Here, we evaluate the potential and economic feasibility of this PV system worldwide by modelling the electricity generation per length of the highway and calculating the levelized cost of electricity (LCOE). We then quantify the CO2e emission reductions based on country-level grid emission factors and estimate the reduced traffic losses via a probabilistic decomposition model that simulates the impact of both road weather conditions and driving speed on the traffic accident risks. Our comprehensive analysis reveals that huge returns can be attained if the highway PV systems are globally implemented and highlights that highway PV deserves attention in formulating global plans to support SDGs.
2 Materials and Methods
2.1 Assessing Electricity Generation Potential
The global highway distribution is acquired from the Global Roads Inventory Project (GRIP) database (Meijer et al., 2018), which provides lengths of freeways, primary roads, secondary roads, tertiary roads, and local roads at a spatial resolution of 5′ × 5′ for 222 countries (Figure S1 in Supporting Information S1). The data were strictly examined for quality in terms of spatial coverage, position error, completeness of attribute information, scale, data aging, etc. We decompose the road length of the central pixel along the north-south (N-S), east-west (E-W), northwest-southeast (NW-SE), and northeast-south (NE-SW) directions according to the road lengths in eight neighbouring pixels (Figure S2 in Supporting Information S1). In this study, we focus on roofing freeways and primary roads with solar panels (collectively termed “highway PV” unless otherwise specified) while also evaluating the potential increment of extending this concept to secondary roads. Freeways refer to major national or regional roadways designed for high-speed vehicular traffic without direct access from properties or minor roads; primary roads are major arteries that carry large volumes of traffic within or between areas; and secondary roads are lesser arteries connecting smaller towns with lower traffic density than primary roads. For detailed characteristics of these road types, please refer to Table S1 in Supporting Information S1. It is noted that roofing solar panels in highway tunnels is impractical, but we are unable to filter out the tunnels due to the lack of road attributes. Given that the proportion of the road tunnel length is less than 1% on a global scale (Table S2 in Supporting Information S1), the uncertainty caused by the tunnels will not conclusively alter our estimates.
The highway PV is illustrated in Figure 1. We consider the installation of polysilicon PV modules with a peak power of 250 W. The length and width of the module are 1.650 m and 0.992 m, respectively. The long side of the PV module is designed to be oriented along the centreline of the highway. We assume that the road width meets the general road design standards that we glean from the reports issued by the United Nations Economic and Social Commission for Asia and the Pacific, the American Association of State Highway and Transportation Officials, the World Road Association and other online sources (Table S1 in Supporting Information S1). Under this assumption, the capacity density of PV installation is 4.84, 3.93, and 2.12 kW m−1 for freeways, primary roads, and secondary roads, respectively. For road lighting, PV panels are spliced together with transparent materials filling their gaps, and no structures are installed between uprights on both sides of highways. Besides, PV panels are fixed at a ten-degree tilt angle (Jacobson & Jadhav, 2018) toward the outside of the highways, allowing precipitation to naturally clean the solar panels (Li et al., 2020). PV roofs are 5.5 m above the highways. Several pilot projects in China, the US, Germany, Austria, and Switzerland have already demonstrated the technical feasibility of such highway PV installation (Enkhardt, 2020; Steven, 2016).
The open-source Global Solar Energy Estimator (GSEE) (Pfenninger & Staffell, 2016) is used to model highway PV electricity generation. GSEE takes hourly direct (Rdir,h) and diffuse (Rdif,h) horizontal solar radiation and ambient temperature (Ta) as inputs. Direct (Rdir,p) and diffuse (Rdif,p) irradiance on solar panels are calculated depending on PV installation geometry and sun position as:
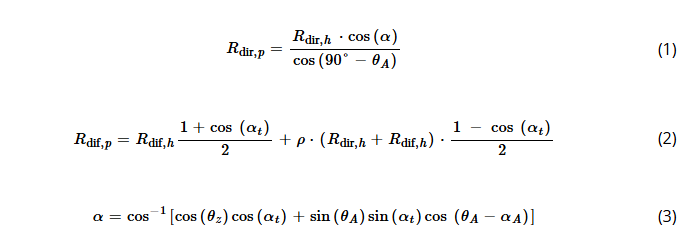
where α denotes the angle between the sun’s rays and solar panels, θA the solar azimuth angle, θz the solar zenith angle, αt the PV tilt angle, αA the PV azimuth angle, and ρ the surface albedo (default value 0.3). The irradiance on panels is further reduced by shading, soiling, and multiple reflection effects (a constant loss of 2% is assumed). The PV module temperature (Tm) varies with Ta and incident irradiance (G, the sum of Rdir,p and Rdif,p) as:
in which cT is the temperature sensitivity parameter to solar radiation (0.035°C W−1 m2 is suggested by Huld et al. (2010)). We assume a 10% loss in the conversion from direct current to alternating current, according to the experiments across 1,029 sites in Europe (Pfenninger & Staffell, 2016). The installed capacity is set to 1 kW, which makes the output equal to the CF, defined as the ratio of a PV module’s actual output (kWh) to its maximum output under a standard test condition (kWp) over a specific period. The hourly solar radiation (Rdir,h and Rdif,h) and temperature (Ta) are taken from the ERA5 data set (Hersbach et al., 2020), which has been used widely in a variety of areas and proven to be of high accuracy. For each grid box, we simulate the CF of solar panels with eight different azimuth angles (αA ∈ {0°, 45°, …, 315°}, Figure S3 in Supporting Information S1). The electricity generation potential of a grid box is calculated as:

where E denotes the electricity generation, D the installed capacity per unit length, and Ld the highway length in direction d. There are eight combinations for d and αA, that is, (N-S, 90°), (N-S, 270°), (E-W, 0°), (E-W, 180°), (NW-SE, 45°), (NW-SE, 225°), (NE-SW, 135°), and (NE-SW, 315°). The simulation is conducted from 2015 to 2021. In addition to solar panels tilted at a ten-degree angle, we further model the PV outputs at a horizontally fixed angle (i.e., αt = 0) and at an optimal latitude-dependent tilt angle (Jacobson & Jadhav, 2018) to investigate the impact of PV tilt angles on the electricity generation.
2.2 Calculating Levelized Cost of Electricity
We use the levelized cost of electricity (LCOE) to analyze the economic feasibility of the highway PV projects (Bódis et al., 2019; IRENA, 2021). The formula for LCOE is:
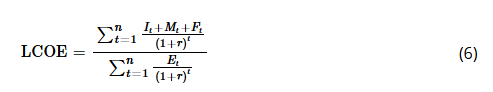
where It represents the capital expenditures in year t, Mt the operation and maintenance (O&M) expenditures, Ft the fuel expenditures (zero for renewable energy projects), Et the electricity generation, r the discount rate and n the lifetime of the PV system (25 years in this study). The LCOE value is the price of electricity required for a project where revenues equal costs. We assume all highway PV modules are installed in the first year of the lifetime at 2020 costs.
We use the statistical data of 16 countries provided by the International Renewable Energy Agency (IRENA, 2021) for the capital expenditures (including solar module costs, inverter costs, racking and mounting costs, grid connection costs, etc.) and compute the continent-level means as the values for other countries within the same continent (Table S3 in Supporting Information S1). Referring to the IRENA report (IRENA, 2021), we assume a constant O&M expenditure of US$17.8 per kW per year in the Organization for Economic Co-operation and Development (OECD) member countries, while US$9.0 per kW per year in non-OECD countries. The discount rate is used to discount future cash flows back to their present value, reflecting the risk and time value of money associated with the cash flows. The weighted average cost of capital (WACC) represents the average rate of return that a company expects to pay security holders to finance its assets and is calculated by weighing the cost of each capital component (equity, debt, etc.) in proportion to their respective share in the company’s capital structure. WACC can be used as a discount rate for evaluating projects and investments (Bódis et al., 2019; Talavera et al., 2017) because it reflects the required return that investors expect to receive from the company and takes into account risk and the proportion of debt and equity used to finance the project. Our calculation assumes a WACC value of 5% for the OECD countries and China, where borrowing costs are relatively low and stable regulatory and economic policies tend to reduce the perceived risk of renewable energy projects, and a WACC value of 7.5% for the other countries (IRENA, 2021). Notably, the capital expenditures provided by IRENA are based on their Renewable Cost Database (IRENA, 2021), which only contains existing utility-scale residential and commercial (mostly ground-based) PV projects worldwide. Consequently, the calculated LCOE values do not entirely reflect the fact that the highway PVs should spend more on the support structures than the ground-based PVs. The worldwide costs of the support structures for the highway PV are unavailable because they have not been extensively implemented. However, we find that the cost of the support structures for the highway PV is approximately four times higher than that for the ground-based PVs, according to some planned PV projects in China (Table S4 in Supporting Information S1). It is reasonable to assume that this proportionality holds for each country because the increase in the cost of the support structures for the highway PV is mainly caused by the rising quantity of construction materials.
2.3 Quantifying CO2e Emission Reductions
By assuming that the electricity generated by the highway PV is delivered to the grid to replace the electricity from other sources, we can estimate the CO2e emission reductions that are considered as one of the co-benefits of highway PV. We calculate CO2e emission reductions (Cr) based on the approach (IPCC, 2006) provided by IPCC:
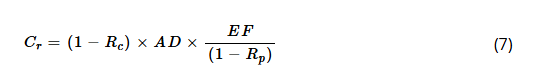
where AD (activity data) is the amount of electricity consumption that equals the electricity generation of the highway PV in this study; EF (emission factor of the grid) refers to the CO2e emission factor (tCO2e MWh−1) that is associated with each unit of electricity supplied by a grid; and Rc and Rp are the PV correction factors for AD and EF, respectively. Rc denotes the PV curtailment rate (%) that characterizes the grid’s ability to absorb intermittent PV electricity, and (1 − Rc) represents the proportion of highway PV generation delivered to the grid. Rp denotes the PV penetration rate (%), defined as the percentage of electricity generated from solar facilities. The grid emission factor has already considered all types of electricity generation in the grid, including zero-emission PV electricity, but the electricity from the highway PV will not replace other PV electricity in the grid. Consequently, the emission reductions calculated directly based on the grid emission factor are underestimated.
Here, we use Rp to correct this underestimation as
![]()
Some countries have published their grid emission factors, such as the ones published by the Ministry of Ecology and Environment of the People’s Republic of China, the Environmental Protection Agency of the United States, and the Department of Energy and Climate Change of the United Kingdom. Recently, the Institute for Global Environmental Strategies compiled a list of grid emission factors for 90 countries based on the registered Clean Development Mechanism (CDM) projects from the United Nations Framework Convention on Climate Change and the official CDM standardized baseline (IGES,2021). We further complement the grid emission factors from some official government documents, the inventory of the Association of Issuing Bodies, the Climate Transparency Report, and Brander et al.’s technical paper (Brander et al.,2011). The extended list contains the grid emission factors for 156 countries/regions (Figure S4a and Table S5 in Supporting InformationS1). We obtain the Rc only for eight countries (i.e., Australia, Chile, China, Germany, India, Japan, and the US), and China’s seven sub-grids (i.e., North Grid, Northeast Grid, Northwest Grid, Central Grid, East Grid, South Grid, and Tibetan Grid). We find that the Rc is linearly correlated with the Rp at the 95% confidence level based on data in China’s seven sub-grids (blue dots in Figure S5 in Supporting InformationS1). The validation against the Rc values in the eight countries (green circles in Figure S5 in Supporting InformationS1) proves the reliability of this linear relationship. Therefore, we estimate Rc for all countries without such factors (Figure S4b in Supporting InformationS1) based on the linear relationship and the country-level Rp values (Figure S4c in Supporting InformationS1).
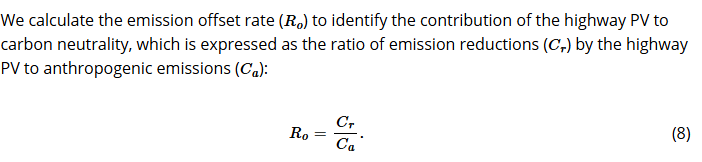
Here, Ca refers to the total CO2e emissions excluding land-use change and forestry (Figure S6a in Supporting Information S1) or the independent CO2e emissions from the transportation sector (Figure S6b in Supporting Information S1) in 2018 (Climate Watch, 2022). Ro ≥ 1.0 indicates that carbon neutrality is ultimately achieved for the whole country (or transportation sector) through highway PV. If Ro < 1.0, the larger value represents a state closer to carbon neutrality. The emissions data in 2018 are collected from the Climate Analysis Indicators Tool (CAIT) developed by the World Resources Institute, which provides a comprehensive and comparable database of CO2e emissions for multiple sectors in individual countries worldwide.
2.4 Estimating Reduced Traffic Losses
We estimate the reduced losses by assuming that the traffic accident risks on highways induced by adverse weather conditions are avoided after highway PV installations. We first estimate country-level losses and then establish a probabilistic model to decompose country-level values to the grid-box-level ones based on the road distribution weighted by the traffic accident risks. The model considers the impact of road weather conditions and driving speeds on the risks since the former leads to spatial divergences while the latter determines the variability among road types. The probabilistic decomposition model is formally expressed as:
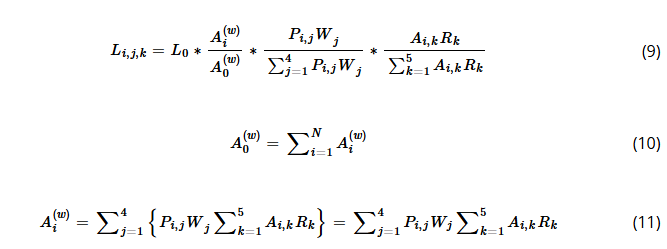
where Li,j,k denotes the traffic loss of the ith grid-box caused by the jth weather on the kth road with i ∈ {1,2,⋯,N}, j ∈ {1: No precipitation, 2: Rain, 3: Sleet, 4: Snow}, and k ∈ {1: Freeways, 2: Primary roads, 3: Secondary roads, 4: Tertiary roads, 5: Local roads}, L0 the country-level loss, N the number of gird-boxes within a country, Pi,j the probability of the jth weather in the ith grid-boxes, Wj the traffic accident risk caused by the jth weather, Ai,k the length of the kth road in the ith grid-boxes, and Rk the traffic accident risk on the kth road.
The benefits from the highway PV are the reduced losses on freeways and primary roads under rainy, sleet, and snowy weather (i.e., j = 2, 3, 4 and k = 1, 2). In fact, many human factors, such as driving under the influence of alcohol and other psychoactive substances, nonuse of motorcycle helmets, seat belts, and child restraints, as well as distracted driving, also increase the traffic accident risk. The impact of these factors keeps consistent across all weather conditions and road types, and therefore is not simulated in this study. Here, we estimate the reduced losses in terms of road traffic deaths and socio-economic burdens associated with traffic accidents. The socio-economic burdens further include economic burdens arising from the dynamic changes in the population, savings behavior, accumulation capital, etc. (Chen et al., 2019), and social burdens in terms of medical treatment, production loss, human costs, property damage, and administrative costs (Wijnen & Stipdonk, 2016). The number of road traffic deaths for each country (Figure S7a in Supporting Information S1) is taken from the World Health Organization (WHO) report (WHO, 2018). The 2020 GDP data (Figure S7b in Supporting Information S1) comes from the World Bank statistics. The traffic-related economic burden as a percentage of GDP for individual countries (Figure S7c in Supporting Information S1) is derived from the study of Chen et al. (2019). For globally estimating the traffic-related social burden, we extract the records from relevant reviews (Bougna et al., 2022; Wijnen & Stipdonk, 2016) and find that the percentage of the social burden in GDP (Wijnen et al., 2009) is linearly correlated with the percentage of the economic burden in GDP at the 95% confidence level (Figure S8 in Supporting Information S1). Based on the linear relationship and the economic burden from Chen et al. (2019), we estimate the percentage of the social burden in GDP for each country without records (Figure S7d in Supporting Information S1). The summed global social burden is US$2.5 ± 0.9 trillion, or 2.9% ± 1.1% of the 2020 GDP (US$84.54 trillion), which is close to the generally accepted estimate of 3% (WHO, 2021).
Malin et al. (2019) analyzed the effects of weather on traffic accident risks from the driver’s view by fusing hourly meteorological, accident, and traffic data. Those values from Malin et al. (2019) (Table S6 in Supporting Information S1) are adopted in our probabilistic decomposition model (Equation 9). The spatial distribution of the probability of different precipitation types (Figure S9 in Supporting Information S1) is calculated using hourly ERA5 reanalysis data during 2015–2021. Logistic regression has been widely used in the literature for the risk-speed relationship (Hussain et al., 2019), and it is presented as various S-shaped curves (Figure S10 in Supporting Information S1). Hussain et al. (2019) systematically investigated 1,479 relevant articles or reports and chose 15 studies that provide sufficient information on the accident risk–speed relationship (blue curves in Figure S10 in Supporting Information S1). In this study, the multivariate meta-regression result (red curve in Figure S10 in Supporting Information S1) based on these 15 studies is used to determine the traffic accident risk for different road types. The expression of the S-shaped curve is:
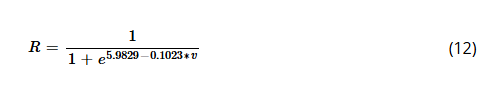
where R denotes the traffic accident risk and v the driving speed. Here, we use the average speed limits as the value of v to calculate the relative risks for different road types (Table S7 in Supporting Information S1).
2.5 Analyzing Investment and Return
We evaluate the net profit (NP) of investing in the highway PV over a 25-year lifetime:
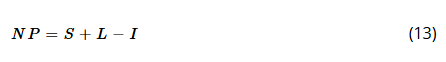
where S represents the electricity sales revenue being equal to the current electricity price multiplied by the electricity generation; L the reduced traffic losses in terms of socio-economic burdens; and I the total investment being equal to LCOE multiplied by installed highway PV capacity. The current electricity prices are obtained from the GlobalPetrolPrices.com website. These prices are collated and cross-checked manually based on multiple data sources and include all items in the electricity bill, such as distribution and energy costs, and various environmental and fuel cost charges/taxes. We note that CO2e emission reductions also bring returns because the social costs of carbon are avoided. However, there are significant uncertainties in quantifying the social costs of carbon (Wagner, 2021). Thus, we only estimate such returns of the highway PV on a global scale based on the study of Rode et al. (2021), which found that CO2 emissions are most likely to generate a social cost of US$2 ± 1 per tCO2. In addition, we compare the capital expenditures (It in Equation 6) with the 2020 GDP to analyze the economic pressure imposed on the different World Bank income country groups (i.e., low-income, lower-middle-income, upper-middle-income, and high-income countries) when developing the highway PV.
3 Results
3.1 Global Potential and Costs
Our assessment shows that globally roofing highways with solar panels can generate 17,578 TWh per year, corresponding to an installed capacity of 13,087 GW if panels are installed at a ten-degree tilt angle. The potential is concentrated in or around densely populated and highly developed areas, such as eastern China, Western Europe, and the eastern US (Figure 2a). China (3,650 TWh yr−1), European Union (EU) countries (2,087 TWh yr−1), and US (2,000 TWh yr−1) account for 44% of the global potential (Figure 2b), due to their vast territory and well-developed highway networks. The global spatial pattern of electricity generation reflects the combined effect of the highway distribution (Figure S1a in Supporting Information S1) and the solar resources (measured by CF, Figure S3 in Supporting Information S1). Spatially variable CFs lead to apparent differences in the electricity generation between countries owning similar installed capacities, for example, Canada versus Brazil and Russia versus Thailand (Figure 2b, Figures S3a, and S11a in Supporting Information S1). We further examine the impact of the tilt angle of the highway PV on electricity generation (Table S8 in Supporting Information S1). Panels tilted at a ten-degree angle produce 233 TWh (0.76%) less per year than horizontally fixed panels, but this loss can be offset by the benefit of soil removal by precipitation on the tilted panels (Li et al., 2020). The annual production of solar panels tilted at the latitude-dependent angles (Jacobson & Jadhav, 2018) is much less since these angles are optimal only for panels facing the equator. The efficiency of electricity generation exhibits significant variability across different climate classifications, as well as notable latitudinal and longitudinal variations (Figure S12 in Supporting Information S1).
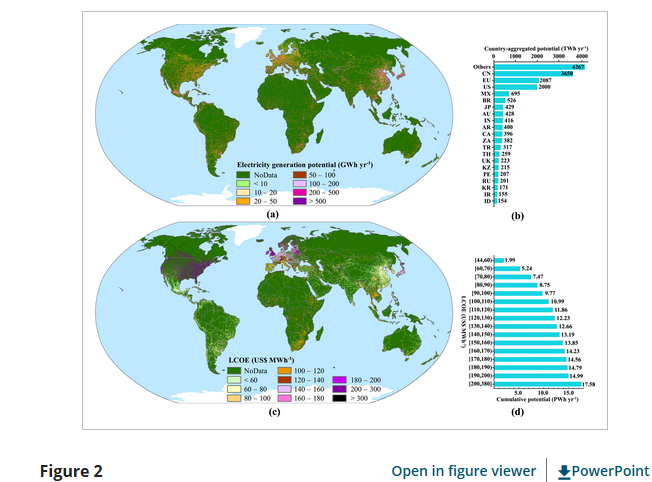
Electricity generation potential and levelized cost of electricity (LCOE) for the highway photovoltaics. (a, b) Global distribution (a) and country-aggregated sums (b) of the electricity generation potential. Note that 27 European Union countries are treated as a whole for the aggregation in (b). (c, d) Global distribution (c) and cumulative potential (d) of LCOE. The bar length represents the cumulative potential. LCOE bins increase with an increment of 10 from US$60 to US$200 MWh−1, but LCOE values are aggregated into one bin when greater than US$200 MWh−1 or lower than US$60 MWh−1. The absolute difference in length between two adjacent bars represents the increased potential that can be realized in the LCOE bin with a longer length.
We analyze the economic feasibility of developing highway PV worldwide based on LCOE and discover conspicuous spatial variability (Figure2c). The global LCOE values range from US$44 to US$380 MWh−1, with the majority (56%) in the range of US$60–120 MWh−1 (Figure2d). The spatial pattern of LCOE is consistent with previous studies (Bódis et al.,2019; Joshi et al.,2021). In Europe, LCOE exhibits an increasing trend from low to high latitudes because attainable electricity per unit of capacity decreases with increasing latitude, but the required investment remains almost invariant (Figure S3 and Table S3 in Supporting InformationS1). In contrast, LCOE in eastern China shows a downward trend with increasing latitude due to higher cloud coverage in the south of China (Jiang et al.,2019; Sweerts et al.,2019). For Africa, countries along the Gulf of Guinea have higher costs to achieve their respective potentials primarily due to lower CFs (Figure S3 in Supporting InformationS1). In the western hemisphere, there are large LCOE gaps (∼US$130 MWh−1) between North America and Latin America, attributed to the distinct capital expenditures. Compared to ground-based PVs, the initial investments in the highway PV are slightly higher because of increased costs on support structures (Table S4 in Supporting InformationS1).
Additionally, we investigate the possible increase in electricity generation by roofing solar panels over secondary roads with broader geographical coverage and higher density (Figure S1b in Supporting InformationS1). The annual electricity generation of the secondary-road PV is 13,570 TWh, corresponding to an installed capacity of 10,191 GW. New hotspots for the secondary-road PV include India, Eastern Europe, Iran, and Brazil (Figure S13a in Supporting InformationS1). US (2,478 TWh yr−1) and India (1,343 TWh yr−1) have the largest increase in electricity generation by adding installed capacities of 1,883 and 871 GW, respectively (Figures S11b and S13b in Supporting InformationS1). By comparison, secondary-road PV is more competitive in India because of the higher electricity generation per unit of installed capacity. The LCOE of the secondary-road PV exhibits a similar spatial pattern to that of the highway PV (Figure2c and Figure S13c in Supporting InformationS1). Nevertheless, the supply cost curve reveals that the average cost of the secondary-road PV is higher than that of the highway PV since the cumulative electricity generation grows faster when the LCOE exceeds US$120 MWh−1 (Figure2d and Figure S13d in Supporting InformationS1).
3.2 CO2e Emission Reductions
The electricity from the highway PV can be delivered to the grid to replace the electricity from fossil fuels, thus contributing to CO2e emission reductions (Figure1). These reductions (Figure3a) are calculated by multiplying the amount of electricity generation by country-level grid emission factors (Equation7). In addition, we calculate the emission offset rate (Figures3b and3c), defined as the ratio of CO2e emission reductions by the highway PV to anthropogenic emissions, to identify the contribution of the highway PV to carbon neutrality (Equation8). Overall, the global highway PV has a capability of reducing CO2e emissions by 9.66 (9.47–9.77) GtCO2e yr−1 (Figure3d). In 2018, the global total CO2e emissions excluding land-use change and forestry (Figure S6a in Supporting InformationS1) were 33.57 GtCO2e and the independent CO2e emissions from transportation (Figure S6b in Supporting InformationS1) were 6.90 GtCO2e (Climate Watch,2022). With reference to both emissions, tapping the full potential of the highway PV can offset approximately 28.78% (28.21%–29.10%) of the global total emissions and completely neutralize the carbon emissions from the transportation system.
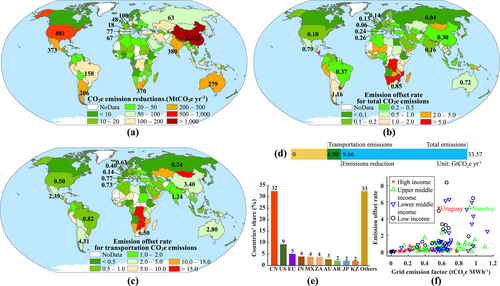
CO2e emission reductions from the highway photovoltaics. (a) Aggregated CO2e emission reductions at country levels. (b, c) Emission offset rate for total CO2e emissions excluding land-use change and forestry (b) and for transportation CO2e emissions (c). (d) Comparison between CO2e emission reductions and total/transportation emissions on a global scale. (e) Top 10 countries’ shares in the global total CO2e emission reduction. (f) The relationship between emission offset rates for country-level total CO2e emissions and grid emission factors for countries among four income country groups classified by the World Bank.
China and the US are the two countries that emit the most CO2, together accounting for about 45% of global emissions in 2018 (Climate Watch,2022) (Figure S6a in Supporting InformationS1). Accordingly, they can reduce their emissions the most. China leads and contributes 3,122 (3,084–3,163) MtCO2e yr−1 (32%), and the US follows and contributes 881 (869–892) MtCO2e yr−1 (9%) (Figures3a and3e and Figure S14 in Supporting InformationS1). Nevertheless, their current emission structures differ significantly, with China’s total CO2e emissions being twice as high as those of the US and China’s transportation CO2e emissions being about half those of the US (Figure S6 in Supporting InformationS1). Therefore, the difference between China and the US is not evident in terms of their emission offset rates for the total CO2e emissions, but China’s emission offset rate for transportation CO2e emissions is six times higher than that of the US (Figures3b and3c). Obvious contrasts are found in CO2e emission reductions within the EU, reflecting the different progress of energy transition across the EU countries (Mata Pérez et al.,2019). Among the world’s major emitters, only China and India can achieve reductions in CO2 emissions through highway PV power generation that exceed the emissions from the transportation sector. This situation is improved by developing the secondary-road PV, which increases global CO2e emission reductions to about 16.98 GtCO2e yr−1, allowing most countries to offset the CO2 emissions from their transportation sectors completely (Figure S15 in Supporting InformationS1).
We find considerable variabilities in emission offset rates for total CO2e emissions among four income country groups classified by the World Bank (Figure3f). Countries with high emission offset rates usually belong to low- and lower-middle-income groups that feature high grid emission factors (Figure S4 in Supporting InformationS1). The exceptions are Uruguay and Namibia, whose primary economic sources are agriculture, livestock, and fishery, rather than industry (Kiesel et al.,2022; Piaggio et al.,2017), leading to their low emissions and high incomes. Emission offset rates are generally low in high-income countries, where the relatively high proportion of renewable electricity results in low grid emission factors (Tian et al.,2022) and, therefore, low CO2e emission reductions from the highway PV. Most upper-middle-income countries have moderate grid emission factors and emission offset rates. These findings remain unchanged if the emission offset rates for transportation are considered (Figure S16 in Supporting InformationS1).