Wind and Solar Energy Development in the World
The Earth is abundant in wind and solar energy resources, yet efficient utilization of these energy sources can only be achieved by converting them into electric power. The world’s wind and solar energy technologies have undergone a slow process of development since the nineteenth century. Since the twenty-first century, wind, and solar energy development has entered a new phase of large-scale exploration, with more importance being attached to clean energy development and new energy technology advancing rapidly.
1.1 Wind Energy Development
In 1887, Prof James Blyth at Anderson’s College, now the University of Strathclyde, in Scotland installed the first power-generating windmill in the world, in his house, marking mankind’s entry into an advanced age of wind energy exploration. The United States, Germany, Denmark, the Soviet Union, and France followed suit by commencing wind energy research, development and application, but overall progress was slow. Since the two severe global oil crises in the 1970s and 1980s, the utilization of wind power has gained global recognition and grown rapidly, under the double impact of the tightening supply of conventional fossil energy and the deterioration of the global ecological environment.
1.1.1 Rapid Growth in Installed Capacity
In the early twenty-first century, Europe and North America were the fastest growing regions in the world in wind energy development. In recent years, Asia has emerged quickly to become the world’s major wind power market. In 2013, global installed wind power capacity totaled 320 GW, accounting for approximately 5.6% of the world’s total, and wind power generation was estimated at 640 TWh, accounting for approximately 2.9% of the world’s total. From 2000 to 2013, both installed wind power capacity and power generation grew 17 times, representing an annual growth rate of 25.0%. See Fig. 2.1 for the world’s installed wind power capacity and growth rates from 2000 to 2013.
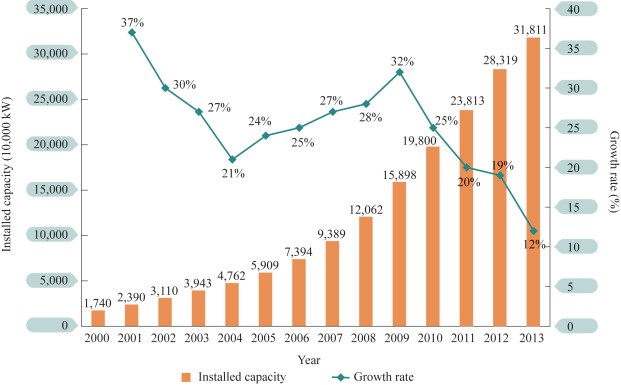
Figure 2.1. World Installed Wind Power Capacity and Growth Rates, 2000–2013
Source: Global Wind Energy Council (GWEC), Annual Market Update 2013.
By the end of 2013, 6 countries in Europe, 2 countries in North America, and 2 countries in Asia were among the world’s top 10 nations in terms of installed wind power capacity. Collectively these countries boasted an installed wind power capacity of approximately 85% of the world’s total. See Table 2.1 for the basic information on the world’s top 10 countries in terms of installed wind power capacity in 2013.
Table 2.1. Basic Information on Top 10 Countries in Terms of Installed Wind Power Capacity, 2013
Rankings | Countries | Installed Capacities (10,000 kW) | Shares of Total Nationwide Installed Power Capacities (%) |
1 | China | 7548 | 6.2 |
2 | USA | 6109 | 5.7 |
3 | Germany | 3425 | 19.3 |
4 | Spain | 2296 | 21.8 |
5 | India | 2015 | 8.1 |
6 | UK | 1053 | 11.1 |
7 | Italy | 855 | 6.9 |
8 | France | 825 | 6.4 |
9 | Canada | 780 | 5.8 |
10 | Denmark | 477 | 33.9 |
Source: Annual Market Update 2013, Global Wind Energy Council (GWEC);
A total of 103 countries and regions around the globe have been developing and harnessing wind energy, with the United States and some European Union countries in particular accounting for a relatively large share of the world’s total capacity. Wind power has become the largest source of power supply in Denmark and Spain, representing, 34 and 21%, respectively, of the total electricity consumed nationwide. Wind power represents 20, 16, and 9% of total electricity consumption in Portugal, Ireland, and Germany, respectively.
1.1.2 Rapid Progress in Wind Power Technology
Wind power technology is concerned mainly with wind energy resources assessment and prediction, wind power equipment manufacturing technology, wind turbine testing, and grid interconnection technology. The development of and breakthroughs in equipment manufacturing technology, being the core of wind power technology, hold the key to realizing large-scale commercialization of wind power. Since the mid-1990s, the world’s major wind turbine manufacturers have stepped up research and development efforts, leading to increasingly mature equipment manufacturing technology and continued improvements in utilization efficiency, technological standards, and system user-friendliness.
First, the continued growth of single-unit wind power capacity has contributed to higher levels of utilization efficiency, lower unit costs, greater economies of scale, and space economy of wind farms. Wind turbines produced in the 1980s typically had a single-unit capacity of only 20–60 kW. Reflecting the growing trend worldwide of single-unit wind power capacity in recent years, the capacity of the world’s major wind turbine models has increased from between 500 kW and 1 MW in 2000 to 2–3 MW in 2013. In 2013, the average single-unit capacity of newly installed wind turbines in the world was 1923 kW. In China, newly installed turbines had an average single-unit capacity of 1720 kW, with 1.5 MW and 2 MW turbines as the mainstream models. See Fig. 2.2 for the International Energy Agency (IEA) report on the changes in the single-unit capacity and hub height of wind turbines in the world.1
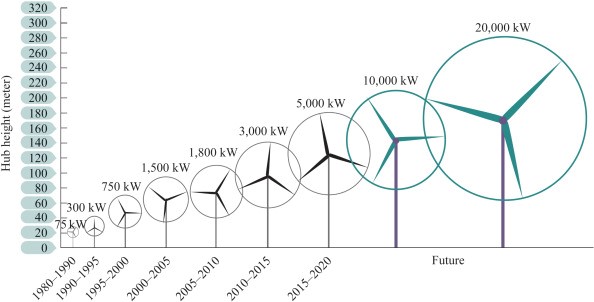
Figure 2.2. Changes in Single-Unit Capacity and Hub Height of Wind Turbines in the world
Source: IEA, Technology Roadmap Wind Energy 2013 Edition.
Second, variable blade pitch control technology has seen major progress to contribute further to turbine stability, safety, and efficiency. Typically, random changes in wind speed and direction cause continuous changes in the angle of attack of the blade, leading to fluctuating output power at the expense of power quality and grid stability. With the employment of variable blade pitch control technology, the angle of blade can be changed in line with the random change in wind speed, and the angle of attack of the wind stream can be maintained within an appropriate range. Power output can be kept stable especially when wind speed exceeds rated wind speed. Variable blade pitch control has been applied extensively in wind turbines (especially large turbines) in recent years. Along with variable pitch applications and power electronics developments, most turbine manufacturers have introduced variable-speed constant-frequency technology (VSCF) and invented variable-speed variable-pitch turbines to align rotational speed change with wind speed and further improve turbine efficiency. Currently, 90% of the world’s installed turbines are VSCF-supported, and the figure continues to rise.
Third, the rapid development of system-friendly wind farm technology contributes to ever-greater controllability and adjustability and gradually improved coordination with conventional power sources and grids. Given the high stochastic volatility and intermittent nature of wind energy, large-scale wind power integration will pose many grave challenges to load balancing, grid safety, and power quality. Conventional wind farms attach more importance to the turbine’s power generation capacity at the expense of the coordination between the turbine, other electrical equipment, grid access for turbines, and wind farms, required to maintain safe and stable grid operations. This produces a serious impact on the maximization of resources and the safety of grid operations. Thanks to the design and control technology employed, a modern wind farm has all the characteristics resembling a conventional power plant, enabling it to fully meet the requirements for generation of performance, as well as stable and safe grid operations. Generally speaking, system-friendly wind farms carry three features. First, they have a wind power prediction system capable of short-term and ultrashort-term projections for dispatching and operation. Second, the turbine is capable of active/reactive power regulation and low voltage ride-through to maintain uninterrupted operation in times of grid fluctuations. Third, there is a focus on optimizing the allocation of active and reactive power control systems to realize remote turbine control.
1.1.3 Rapid Development of Wind Power Generation Equipment Industry
Driven by the continued growth of market demand, the wind power generation equipment industry is developing rapidly. By the end of 2013, global whole-system turbine manufacturing capacity amounted to approximately 55 million kW on an annual basis. Turbine manufacturers were concentrated in China, the United States, Germany, Denmark, and Spain. China alone accounted for 50% of the world’s total production capacity. Among the top 10 wind turbine manufacturers in 2013, 3 were from China, 3 from Germany, 1 from the United States, 1 from Denmark, 1 from Spain, and 1 from India. See Table 2.2 for the basic information on the world’s top 10 turbine manufacturers in 2013.
Table 2.2. Basic Information on the World’s Top 10 Turbine Manufacturers
Rankings | Manufacturers | Countries | Installed Capacities (10,000 kW) | Market Shares (%) |
1 | Vestas | Denmark | 489.3 | 13.1 |
2 | Goldwind | China | 411.2 | 11.0 |
3 | Enercon | Germany | 368.7 | 9.8 |
4 | Siemens | Germany | 277.6 | 7.4 |
5 | GE | USA | 245.8 | 6.6 |
6 | Gamesa | Spain | 206.8 | 5.5 |
7 | Suzlon | India | 199.5 | 5.3 |
8 | United Power | China | 148.8 | 4.0 |
9 | Mingyang Wind Power | China | 129.7 | 3.5 |
10 | Nordex | Germany | 125.4 | 3.3 |
Others | 1144.8 | 30.5 | ||
Total | 3747.8 | 100 |
1.1.4 Significant Improvement in Wind Power Economics
The economics of wind energy are a function of power generation costs, with investment costs, operation and maintenance costs, resource availability, and grid-based consumption capacity as the major contributing factors. The wind turbine, as the core component of the wind power generation system, accounts for approximately 70% of the total investment in a wind farm. Lower turbine costs are driven by improved economies of scale and technological advancement. The reduction in wind power costs since 2005 has mainly reflected the benefit of growing development capacity, while the impetus to drive costs further down is expected to come more from technological innovation and breakthrough.
Fierce competition in the wind power generation equipment market over the years has led to lower turbine prices across the board. With rapidly growing demand and fast-expanding manufacturing capacity, turbine prices are falling significantly, especially after the global financial crisis in 2008. In China, turbine prices fell by 37% on an aggregate basis between 2008 and 2010. Following the restructuring and consolidation of the global wind power market, indiscriminate capacity expansion has been kept in check, market competition has witnessed a return to rationality, and the downward trend of turbine prices has slowed. See Table 2.3 for the turbine prices in the world market and mainland China between 2008 and 2013.
Table 2.3. Turbine Prices in Global and Chinese Markets, 2008–2013
Years | Global Market Prices (Yuan/kW) | Turbine Prices in China (Yuan/kW) |
2008 | 11,109 | 6,300 |
2009 | 10,064 | 5,000 |
2010 | 8,500 | 4,000 |
2011 | 7,800 | 3,800 |
2012 | 7,371 | 3,600 |
2013 | 7,130 | 3,500 |
Source: Ref. [22]; China Wind Energy Development Report 2014, Renewable Energy Committee, China Association of Circular Economy.
Wind power generation costs around the world have shown a steadily downward trend year by year. From 1980 to 2005, wind power generation costs globally went down over 90%. Currently, the investment costs of onshore wind power projects stands at US$ 970–1400 per kW and electricity generation costs at around 10 US cents per kWh. China’s wind power generation costs have dropped to RMB 0.45–0.55 kWh. By 2020, the overall production costs of onshore turbines are expected to fall a further 20–25% and offshore turbines a further 40%, bringing with them lower electricity generation costs. Driven by more advanced wind power technology and growing development capacity, wind power may become more price-competitive as costs are likely to fall to a level comparable to or even lower than conventional fossil fuel-fired power generation costs.
1.1.5 Global Efforts to Support Wind Power
To cope with climate change, optimize the energy structure, and foster emerging industries of strategic importance, countries worldwide are gradually expanding the capacity of the wind power market through incentive policies designed to encourage wind energy development. The stage is already set for strong growth in wind power worldwide. Development is expected to accelerate even further with some countries and regions having announced their own wind power planning objectives.
The United States encourages wind power development primarily through policy on production tax credit and quotas for renewable energy development. The production tax credit works as a subsidy calculated on a per kilowatt hour basis, and the renewable energy quotas implemented at the state level have been made into law to set the share of renewable sources, in total electricity consumption at a designated level. In 2008 the United States Department of Energy carried out a feasibility study, 20% Wind Scenario, which found a 20% share of total electricity consumption by 2030 as a practicably achievable target for wind power.
European countries encourage wind power development primarily through subsidies on a per kilowatt hour basis. Under this system, either fixed feed-in tariffs set directly by government are provided, at which power purchased by grid operators is calculated or wind farms can participate directly in tenders with the government providing a subsidy based on market tariffs. According to the National Renewable Energy Action Plan submitted by EU nations in 2010, installed wind power capacity and wind power generation in the European Union are expected to reach over 200 GW and 500 TWh by 2020, respectively, accounting for 12.7% of total electricity consumption in that year. The Turkish government, for instance, is planning to achieve a total installed wind power capacity of 20 GW by 2020.
India has set up the National Clean Energy Fund to fund technology research and projects in clean energy. A total of 17 members from 25 Central Electricity Regulatory Commissions have jointly promulgated the Regulations for Renewable Purchase Obligation and 18 “pradeshes” (provinces) have announced a feed-in tariff setting mechanism for wind power. In addition, India has moved to cut import duty on certain turbine components from 10% to 5% and waive a 4% surcharge on the procurement of related raw materials. By the end of 2013, onshore installed wind power capacity had surpassed 20 GW, with the development of offshore wind power expected to accelerate.
In China, the Renewable Energy Act of the People’s Republic of China sets forth a renewable energy policy system covering priority grid access, benchmark tariffs, and cost apportioning. With effect from 2009, the territory of China has been divided into four different classes of wind resource regions, where four levels of benchmark feed-in tariffs apply, respectively, RMB 0.51, RMB 0.54, RMB 0.58, and RMB 0.61 per kWh, respectively. At the end of 2014, the benchmark feed-in tariffs for Classes I, II, and III wind resource regions were readjusted downward by RMB 0.02 per kWh and the tariffs for Class IV regions have remained unchanged. Also, wind energy development funds were subsidized by means of a renewable energy surcharge imposed on electricity sales to end-users. By 2020, onshore installed wind power capacity is expected to double from the current level to 200 GW.
Solar Energy Development
In 1839, French scientist Henri Becquerel discovered the photovoltaic (PV) effect. The first utilitarian monocrystalline silicon solar cell (mono c-Si) was invented by Bell Laboratories in the United States in 1954, giving birth to a utilitarian PV technology to convert solar energy into electric power. Since the 1970s, solar power generation has gained increasing policy promotion and attention in the world. Under the government-level Sunshine Project launched in the United States in 1973, spending on solar energy research received a significant boost, with the establishment of solar energy development banks to promote the commercialization of solar power products. In 1974, Japan’s equivalent of the Sunshine Project was announced, with the program incorporating solar energy R&D technologies such as solar houses, industrial solar systems, solar thermal power generation systems, solar cell manufacturing systems, PV distributed generation (PV–DG), and large PV systems. Germany launched its 2000 Photovoltaic Roofs Project in 1990, followed by the Million Solar Roofs Program in the Netherlands in 1998. From 2009 to 2013, China implemented the Golden Sun Project, providing fiscal subsidies for PV–DG programs in a move that set the domestic PV power generation market in motion.
1.2.1 Rapid Growth in Installed Solar Power Capacity
In recent years, technological progresses have driven down the costs of PV and solar thermal power generation so quickly, that solar energy has become the fastest growing clean energy. In 2013, the world’s total installed solar power capacity came to 142 GW, accounting for 2.5% of the world’s total installed power generation capacity, and total solar power generation was 160 billion kWh, accounting for approximately 0.7% of the world’s total electricity generation. Between 2000 and 2013, the world’s installed capacity and electricity generation from solar power skyrocketed by around 86 times, accounting for an average annual growth of 40.9%. See Fig. 2.3 for the world’s installed solar power capacity and growth rates between 2000 and 2013.
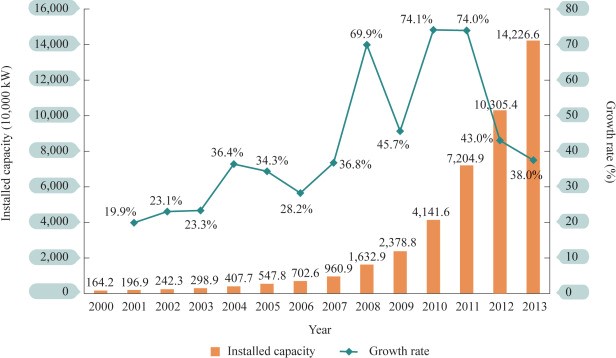
Figure 2.3. World’s Installed Solar Power Capacity and Growth Rates, 2000–2003
Among the world’s top 10 countries in terms of installed PV capacity in 2013, 6 were in Europe, 2 in Asia, 1 in North America, and 1 in Oceania. The 10 countries represented 86% of global installed PV capacity. In recent years, China’s solar power industry has grown rapidly, as evidenced by the establishment of a megawatt-grade PV power generation base in Qinghai Province. See Table 2.4 for the basic information on the world’s top 10 countries in terms of installed PV capacity in 2013.
Table 2.4. Basic Information on the World’s Top 10 Countries in Terms of Installed PV Capacity in 2013
Rankings | Countries | Installed PV Capacities (10,000 kW) | Share of Domestic Installed Capacities (%) |
1 | Germany | 3571 | 20.1 |
2 | China | 1942 | 1.6 |
3 | Italy | 1793 | 14.4 |
4 | Japan | 1381 | 4.7 |
5 | USA | 1373 | 1.3 |
6 | Spain | 534 | 5.1 |
7 | France | 467 | 3.6 |
8 | UK | 338 | 3.6 |
9 | Australia | 330 | 5.2 |
10 | Belgium | 298 | 14.3 |
Source: EPIA, Global Market Outlook for photovoltaic 2014–2018.
Europe currently leads the world in terms of PV power generation capacity. In 2013, PV power generation became the second most widely utilized new power source after wind energy for the third consecutive year, meeting 3% of Europe’s total electricity needs. In some European countries, PV power generation accounted for an even larger share of maximum load. In 2013, instantaneous PV power output as a share of maximum load amounted to 49% in Germany, 20–25% in Italy and Spain, and even up to 77% in Greece. See Table 2.5 for the PV maximum power output (MPO) in selected European countries in 2013.
Table 2.5. PV MPO in Selected European Countries, 2013
Countries | PV MPO (10,000 kW) | System Minimum Loads (10,000 kW) | MPO as a Share of System Minimum Loads (%) |
Germany | 2349 | 3480 | 67.5 |
France | 304 | 3372 | 9.0 |
Italy | 1322 | 2506 | 52.8 |
Spain | 388 | 2128 | 18.2 |
Belgium | 210 | 688 | 30.5 |
Czech | 137 | 493 | 27.8 |
Greece | 198 | 222 | 89.2 |
Bulgaria | 67 | 273 | 24.5 |
Note: The table covers the period from May 2013 to September 2013 when PV power output in Europe was at its highest level.
Source: EPIA, Global Market Outlook for photovoltaic 2014–2018.
More and more countries are actively exploring solar thermal power generation, building and putting into operation a number of typical projects. In 2011, the Sevilla solar thermal farm was completed and commissioned in southern Spain. With an installed capacity of 20,000 kW and molten salt for heat storage, it is the first 24-h operating solar thermal farm in the world. In February 2014, the Ivanpah solar thermal power station was connected to the grid and became operational. With a total installed capacity of 392,000 kW, the power station consists of three concentrated solar power towers with an installed capacity of 133,000, 133,000, and 126,000 kW, respectively. Known as the largest of their kind in the world, the three towers alone accounted for 30% of the total installed solar thermal power capacity then in the United States. In July 2013, the first phase (10,000 kW) of the Supcon (Delingha) 50,000 kW solar thermal farm in Qinghai was successfully connected to the grid, marking a solid step forward in the commercialization of China’s proprietary solar thermal power generation technology.
1.2.2 Fast-changing Solar Power Generation Technology
Solar power generation technologies, including solar photovoltaics, solar thermal power, related materials, and processes, are undergoing a continued process of innovation. Crystalline silicon cell (c-Si) technology accounts for over 85% of the market and is expected to remain the mainstream technology in 2025–2035, reflecting a trend toward higher efficiency and thinner wafers. Thin film solar cell (TFSC) technology has also been improving to such an extent that it now accounts for approximately 15% of the market. In terms of energy conversion efficiency, the c-Si cell has been improving at an annual rate of 0.5%. In this respect, the conventional c-Si cell has achieved an efficiency of 16–18%, compared to 20–23% for the heterojunction with intrinsic thin layer (HIT) c-Si cell, and 20–21% for the back-contact c-Si cell. Among the different TFSC cell types, the cadmium telluride (CdTe) cell has achieved an efficiency of 9–11%, compared to 13–15% for the copper indium gallium selenide (CIGS) cell. Both cell types have maintained continuous efficiency improvement at an annual rate of 1.0–1.5%. See Table 2.6 for the efficiency of the major solar cell types around the world.
Table 2.6. Efficiency of Major Solar Cell Types in the World
Empty Cell | Solar Cell Types | Energy Conversion Efficiencies (%) | |
c-Si cell | Conventional cell | 16–18 | |
Specially structured cell | HIT | 20–23 | |
Back-contact | 20–21 | ||
TFSC cell | Chemical cell | CdTe | 9–11 |
CIGS | 13–15 | ||
Crystallite silicon (c-Si) cell and amorphous silicon (a-Si) cell | 9–10 | ||
Amorphous silicon (a-Si) cell | Single-junction | 5–6 | |
Double-junction | 6–8 | ||
Multijunction | 8–12 | ||
Concentrator solar cell (CSC) | Low concentration | 30–40 | |
High concentration | |||
Source: Wang Sicheng, Latest Breakthroughs in Photovoltaic Power Generation and the New Photovoltaic Package Deal.
1.2.3 Rapidly Growing Solar Power Industry
In the polycrystalline silicon (poly-Si) industry, global capacity amounted to 393,000 tons and production reached 227,000 tons in 2013, with an average capacity utilization rate of 57.8%. In terms of poly-Si capacity, China ranked first in the world with approximately 151,000 tons or around 38.4% of the world’s total. The United States was second-placed with nearly 76,000 tons or around 19.3% of the world’s total. South Korea, Germany, and Japan came third, fourth, and fifth, respectively, with 57,000, 52,000, and 26,000 tons in the same order. In terms of poly-Si production, China ranked first with a total output of 82,000 tons or 36.1% of the world’s total. The United States came second with 59,000 tons or 26.0% of the world’s total. Germany, South Korea, and Japan produced 46,000, 41,000, and 13,000 tons, respectively, accounting for 20.3, 18.1, and 5.7% of the world’s total in the same order.
In the solar cell industry, global capacity was estimated at approximately 78 GW and production at approximately 39.5 GW in 2013, with a capacity utilization rate of around 50.6%. In 2013, global c-Si solar cell capacity reached approximately 69.6 GW. Ranking first globally, China claimed the lion’s share of this amount, with 49.30 GW or 70.8% of the world’s total. In 2013, global production of c-Si solar cells was estimated at approximately 35.5 GW, divided in the ratio 3:1 between the poly-Si and mono-Si cell types. Production in mainland China totaled 21.5 GW, accounting for around 60.6% of the world’s total and ranking first globally. Production in Taiwan totaled 8.5 GW, accounting for around 23.9% of the world’s total and ranking second globally. Production in Southeast Asia, Japan, and South Korea was around 2400 MW, 1700 MW, and 1500 MW, respectively, accounting for 6.8, 4.8, and 4.2% of the world’s total in the same order. In 2013, global TFSC cell capacity totaled around 8.41 GW, doubling the level in 2010. By technology type, production capacity of Si-based, CIGS TFSC, and CdTe TFSC cells accounted for 50, 22, and 28%, respectively. In 2013, global TFSC cell production totaled about 3.95 GW, up 9.1% from 2010.
In the solar components industry, global production capacity surpassed 76 GW and production reached 43 GW in 2013. Production capacity of c-Si cell components was estimated at around 68.4 GW, compared to around 8000 MW for TFSC components, and 230,000 kW for concentrator solar cell components. China was the largest producer with an output of 27.4 GW in 2013, with c-Si cell components representing 99% of total production. Europe ranked second, producing 3.8 GW, around 20% of which was attributable to TFSC components. Japan produced about 3.5 GW, with c-Si cell components and TFSC components accounting for 71.4 and 28.6%, respectively of the total. Southeast Asia, South Korea, and the United States produced 2.8, 1.7, and 1 GW, respectively.
1.2.4 Steadily Improving Economics of Solar Power Generation
Along with sharply lower prices of PV cells and components, the construction costs of PV power stations around the world have fallen to US$ 1500 per kW. In China, a number of key enterprises have mastered the complete manufacturing processes of poly-Si and c-Si cells up to a production level of 10,000 tons, leading to increasingly lower PV equipment costs. Since 2010, the investment costs of poly-Si cells per 1000 tons have gone down 47%, compared to a more than 55% decline in the investment costs per megawatt of c-Si cells. Silicon consumption has also dropped by 25%. Investment in PV power generation systems had fallen from RMB 25,000 per kW in 2010 to RMB 9,000 per kW in 2013. Investment in PV–DG farms ranged from RMB 9,000 per kW to RMB 11,000 per kW. See Table 2.7 for the investment costs of PV power generation in selected countries in 2013.
Table 2.7. Investment Costs of PV Power Generation in Selected Countries, 2013
PV Power Type | Australia | China | France | Germany | Italy | Japan | United Kingdom |
|
Residential | 1.8 | 1.5 | 4.1 | 2.4 | 2.8 | 4.2 | 2.8 | 4.9 |
Commercial | 1.7 | 1.4 | 2.7 | 1.8 | 1.9 | 3.6 | 2.4 | 4.5 |
Ground-mounted | 2.0 | 1.4 | 2.2 | 1.4 | 1.5 | 2.9 | 1.9 | 3.3 |
Source: IEA, Technology Roadmap Solar Photovoltaic Energy 2014 Edition.
PV power generation costs are falling quickly. Generation costs per kilowatt hour are falling significantly due to maturing PV power generation technology, increasing equipment utilization hours, and declining system-manufacturing costs. In solar resource-rich regions like California, Germany, and Italy, generation costs per kilowatt hour have dropped to a level below end-user tariffs and are increasingly drawing closer to conventional power tariffs set based on the most stringent environmental standards. In 2013, Germany achieved a generation cost of US$ 0.11–0.19 per kWh, which could go down to US$ 0.08 per kWh if the annual solar irradiation intensity should exceed 2000 kWh/m2.2 Large ground-mounted PV solar power plants in Western China achieved a generation cost of RMB 0.7–0.9 per kWh, and the figure in Eastern China was RMB 0.9–1.2 per kWh.
At US$ 4000–9000 per kW, the investment costs of solar thermal power generation are relatively high around the world, with the unit cost varying greatly with solar resources and the availability and capacity of heat storage facilities. The cost of building the Delingha solar power tower in Qinghai without a heat storage system cost is estimated at RMB 18,500 per kW, compared to RMB 27,800 per kW for a tower with a 2-h heat storage system.
The costs of solar thermal power generation around the world remain higher than those of PV power generation. Take operating projects as an example, 40% of Spain’s solar thermal power plants are equipped with a 4-h energy storage system and governed by a feed-in tariff rate of US$ 0.4 per kWh. In Morocco, the Ouarzazate solar thermal power plant, with a 160,000 kW installed capacity and a 3-h energy storage system, is governed by a feed-in tariff rate of US$ 0.19 per kWh. At 110,000 kW, the Nevada Crescent Dunes solar power tower with a 10-h heat storage system is governed by a feed-in tariff rate of US$ 0.135 per kWh, but the actual tariff stands at around US$ 0.19 per kWh after adjustment for the preferential policies implemented. Based on different technology packages and combinations of units, the generation costs of solar power towers in China can be controlled at RMB 1.2–1.5 per kWh.
1.2.5 Worldwide Support for Solar Power Generation
Driven by policy incentives in different countries, PV power generation worldwide has been entered a period of tremendous growth from a low level of development initially confined to a few nations. By contrast, solar thermal power generation is still in the stages of technology development and experimental demonstration. From the perspective of policy trends and planning around the world, solar power is expected to maintain rapid development and even outgrow wind power over time.
The United States provides policy support for the PV industry in terms of technology research and tax refund. An investment tax credit program is available to refund 30% of the total investment in a lump sum or over a specified period of years, which is equivalent to a front-end investment subsidy for PV projects. In 2010, the Senate Committee on Energy and Natural Resources voted through the Million Solar Roofs Initiative, with plans to invest at least US$ 250 million each year as a roof-mounted PV project subsidy from 2013 to 2021. Furthermore, many State governments promulgated incentive policies on solar power generation. For example, California officially commenced the California Solar Initiative in 2007, planning to invest approximately US$ 2.2 billion over a 10-year period in front-end investment subsidies or feed-in tariff subsidies for solar power projects with a total capacity of nearly 2 GW. It is anticipated that installed PV capacity will have surpassed 100 GW by 2021.
Europe provides primarily tariff-based stimulus packages for PV power by requiring grid operators to purchase PV power as a priority and pay for the power based on government-mandated fixed feed-in tariffs, or by offering grid operators appropriate subsidies based on market tariffs, a policy similar to that applicable to wind power. Meanwhile, Germany and some other European countries encourage end-use consumption of electricity generated by customer-side PV projects, with any residual electricity to be fed into the grid. The significant fall in PV power generation costs has led the European countries to cut back upon incentives and lower subsidy levels in an orderly manner. It is expected that Germany will begin to scrap its subsidy policy for new PV power generation projects from 2017. According to the National Renewable Energy Action Plan submitted by European Union member nations in 2010, European Union countries will have installed a total solar power capacity of over 90 GW by 2020, including 84 GW of solar PV power. The Turkish government, for instance, has planned to build a total installed PV power capacity of 5 GW by 2020.
India launched the Jawaharlal Nehru National Solar Mission in 2009, with specific principles and directions proposed for building India into the world’s major solar energy consumer. A robust policy and management framework was also established to achieve the goal of building 20 GW of installed grid-connected PV capacity and 2 GW of installed off-grid PV and thermal capacity in three stages by 2022. In 2014, Indian Prime Minister Narendra Modi set another goal to bring installed PV capacity to 100 GW, five times the target envisaged in the Jawaharlal Nehru National Solar Mission, by 2020.
China started implementing the Golden Sun Project in 2009 to subsidize approximately 50% of the initial investment for industrial parks and other operators of PV–DG programs, opening up a new era of large-scale development in PV power generation. By the end of 2012, the installed PV–DG capacity of the Golden Sun Project exceeded 6 GW. In 2013, China formally promulgated a policy governing PV power tariffs. Under the policy, China was divided into three solar resource regions according to the availability of solar energy and construction costs. Benchmark feed-in tariffs were set at RMB 0.9, RMB 0.95, and RMB 1 per kWh, respectively for the three regions and PV–DG power generation projects were offered an RMB 0.42 per kWh subsidy. According to plan, China’s installed PV power capacity will have reached 100 GW by 2020, approximately 65 GW of which was attributed to ground-mounted PV power stations.
All in all, global wind and solar energy development is growing rapidly, with increasingly sophisticated technology and improved economics. Given government support worldwide, the prospects of this energy sector are bright, and a foundation is laid to resolve the increasingly severe energy and environmental problems.
China is the global leader in terms of installed wind capacity. Further, wind energy development is expected for the next years and decades to meet the continuously increasing electricity demand and the need of using clean domestic energy. Since 2009 China is divided into four geographical regions, each assigned with a different benchmark on-grid tariff. Moreover the existing infrastructures are not equally developed throughout the country, making investment decisions more complicated and risky. The scope of this paper is to apply an innovative methodology and evaluate the attractiveness of each region for wind energy development, by taking into consideration all relevant investment risks, such as wind potential, wind curtailment, access to the grid and macroeconomic parameters. To this purpose a Monte Carlo simulation approach, integrated into a typical financial model, is implemented in each of the four regions, performing many hundreds of iterations, each characterized by a randomly selected set of the examined uncertain parameters. This approach intends to provide information to private investors doing a first exploratory research in the huge country׳s area in order to decide whether and where to invest, as well as to policy makers to help them assess critical policy parameters and investigate different scenarios of wind energy development. The evaluation of the current framework for wind energy development in China verifies that the existing system of feed-in tariffs in China is very effective for the balanced deployment of wind energy in the whole country. However, it is shown that the risk of curtailment and grid accessibility may significantly reduce the potential profitability of wind energy investments in all four regions. Priority for development of infrastructures should be given in isolated northern windy areas with high-accumulation of wind farms.
2.21.5 Conclusions
A significant increase of wind energy is expected globally and the technology will start to play a new role in the market. Wind energy development has always been strongly policy-driven—as most energy technologies have —and this is expected to continue in the future. Policies employed for wind energy range from basic R&D to direct investment support and include fiscal incentives, production-based support, public finance mechanisms and regulations. Sharp cost declines will diminish the need for production-based support payments for wind energy in some countries, but this does not mean that policy challenges around wind energy will disappear or even reduce—they merely change their nature as compared to the earlier days of technology introduction.
Vast amounts of investments will be needed to realize the transition to zero-carbon energy systems and this requires long-term, adequate and consistent policies to attract private investment. Long-term build-out targets and flexibility to learn and adjust policies will be crucial. The systematic development of policy frameworks to reduce risks and to enable stable returns will facilitate the future deployment. A mix of policy instruments will be required, targeting not only the deployment of wind energy itself (by providing adequate value through support and clearly defined access to networks and markets), but also the energy system as a whole (by e.g., adapting market designs, driving electrification and digitalization), the support of supplementary technologies (e.g., batteries and hydrogen production) and infrastructure (e.g., ensuring adequate electricity networks), as well as an enabling environment (by creating long-term stability; transparent, consistent and easily accessible policy goals and regulation; emphasizing inclusiveness and activation of diverse stakeholders’ groups and attention to vulnerable customers and citizens).
The global challenges to achieving a sustainable energy system can only be solved through coordinated policy actions and not through market forces alone. Policy makers have to carefully manage their policy packages to create an adequate mix of policy instruments and create enabling environments to allow wind energy to take the leading role in the future energy system that is commonly envisaged for the technology.
Development of Wind Energy Industry
Within the wind energy development process in Lithuania, there was a primary assessment of wind energy resources performed in 2008 based on historical records of observations from weather stations, and methods for their calculation were designed. According to surveys, wind power energy development is feasible and justifiable from an economic point of view. In western Europe and Lithuania, it is mandatory to perform measurements of wind parameters using appropriate equipment in a particular territory 6 to 12 months before beginning to construct wind power plants. It allows choosing appropriate facilities for wind power plants, draw up their operation schedules, predict their energy output, and define economic indicators. Building wind plants requires analyzing variation of wind parameters, formation of windblasts, profiles of wind velocity according to the earth’s surface roughness and residential density of the territory, and formation of wind flows beyond natural and urbanistic barriers (Vieira da Rosa 2009).
As is seen from the Lithuanian wind atlas (see Figure 19), there is a sufficient number of territories in Lithuania where the average wind velocity exceeds 5 m/s and which are suitable for constructing wind plants in them. Unfortunately, there is a major obstacle—rather high residential density and lack of free sites for building wind plant farms.
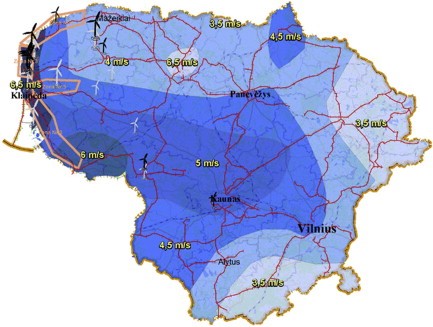
Figure 19. Lithuanian wind atlas
(Source: http://www.vejoekspertai.lt/lietuvos_vejo_zemelapis.html).
Development of the wind power industry in Lithuania started in 2002, when the first wind station with a capacity of 160 kW was built near Skuodas. In 2004, a 630-kW plant was built in Vydmantai and connected to the electricity network. The largest wind plant farm was established in the coastline area of Lithuania, between Palanga and Klaipėda. Its capacity reaches 30 MW, and the annual production of electricity is about 64 MWh. According to data from the Lithuanian Wind Power Association, until May 2012, wind power plants operating in Lithuania generated 430 million kWh of electricity, saved 42.6 million m3 of gas, and prevented emission of 78,900 tons of CO2 (European Wind Energy Association 2011; Tallat-Kelpsaite, Polocka & Spizley 2011).
Development of the wind power industry has also encountered technical difficulties. The major of these are balancing energy due to variable wind flows. Figure 20 shows wind energy produced in March 2012 against the same month’s forecasts. In order to ensure a steady supply of electrical energy to users, it is essential to have backup facilities installed and a network allowing transmitting unstable flows of produced energy.
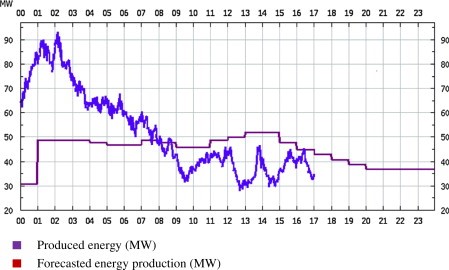
Figure 20. Wind energy balance in March 2012, Lithuania (Litgrid, JSC,http:// www.litgrid.eu).
In order to ensure the balances of electrical energy and capacity, as well as safe functioning of the power industry’s system, the maximum capacity of wind stations within the Lithuanian power industry system should not exceed 170 MW. Such capacity is sufficient for meeting the EU commitments. A capacity of the coastline wind plants exceeding 170 MW would cause an increased loss of energy within the transmission network, too heavy power flows, and voltage regulation problems.
Wind plants generate inexhaustible clean energy, although there are opinions that wind stations may influence health in the long term; moreover, opponents hold the view that power plants may damage ecosystems by changing customary migration routes of birds and insect populations, thus having a negative impact on local agriculture, etc. Expansion of wind plant farms is also prevented by limited land areas, large sanitary zones, and complicated provisions for connecting to transmission and distribution networks, as well as population’s opposition. For that reason, the world’s common practice is to build powerful offshore wind power farms.
Problems related to wind power technologies are solved by improving technologies themselves. The present level of technologies in Lithuania allows only part of the territory (preferably, the coastline area) to be used for extracting wind energy. Unfortunately, Lithuania’s coastline stretch is not very large and almost the whole of it is used as a recreation zone. The Curonian Spit cuts across bird migration routes. It is considered that only a few dozen powerful wind plants could be built during the next few decades.
Considerable drawbacks of the wind power industry still could be considered their slow payoff and high net cost of produced energy. In many countries, notably EU, energy generated by wind power stations is subsidized or otherwise supported. The efficiency of wind plants has been increasing lately; the wind power industry, therefore, is considered one of the most perspective modes of electricity generation. The most rapid progress of the wind power industry in Europe is observed in such countries as Denmark, Spain, and Germany, which now may boast of the most powerful potential for wind energy production.
3.7 Classification of global ocean wind energy resource
According to technical standards for wind energy resources development created by the DOE (Department of Energy of the United State) and National Development and Reform Commission of China, wind energy can be classified into indigent area (area not suitable for wind energy development), available area (although not rich region, wind energy development can also be carried out), subrich area (relatively abundant area, which is suitable for wind energy development), and rich area (abundant area, which is very suitable for wind energy development). These classes ranged from Class 1 (the lowest) to Class 7 (the highest), as shown in Table 1.
As part of this study, we created a grade classification map of the global ocean wind energy resource based on the CCMP wind field data for the period 1988–2011 and using the wind energy grading standards of the DOE (Table 1; Fig. 9).
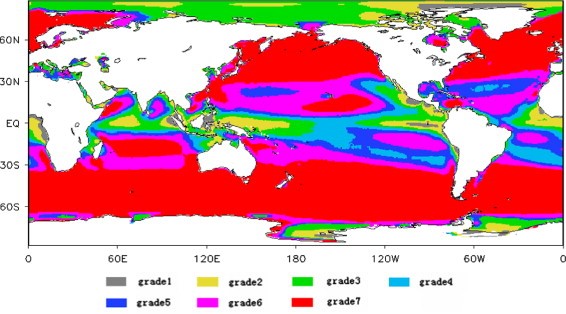
Fig. 9. Grade classification map of the global ocean wind energy resource.
Fig. 9 shows that most of the global oceans are rich in wind energy resources, and especially enriched are the westerly belts of both hemispheres. Indigent areas are mainly scattered around the equator and poles, while available and subrich areas are found in low-latitude waters, the coastal waters of the eastern Pacific Ocean at mid to low latitudes, and most of the waters around the poles.
While the global oceans are rich in wind energy resource, the difficulties associated with electrical power generation and transmission, including shortages of conventional energy, is increasing. The vigorous development of wind energy may offer one approach to tackling these problems.
3.3 Wind projects social benefits
One of the main social benefits of the wind energy development is the contribution to the minimization of the operation of coal and oil-fired or natural gas-based thermal power stations. More specifically, the operation of wind-based power stations first of all reduces the energy imports, while they lead to emissions reduction. In Fig. 5 the global wind power capacity and avoided CO2 emissions for the period 2008–2030 is depicted. Furthermore, the exploitation of wind energy improves the security of energy supply, since it minimizes the dependency to fossil fuel reserves or oil imports.
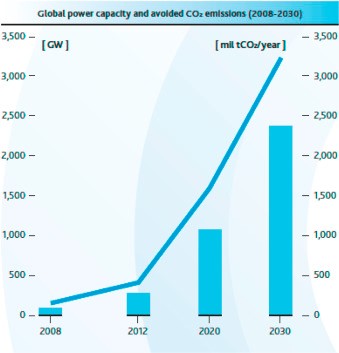
Fig. 5. Global power capacity and avoided CO2 emissions (2008–2030)
As with most business ventures, new jobs and activities are created in the areas where the wind parks are installed, thus regional development is achieved. The sectors associated with the wind energy create direct or indirect employment that include the turbine manufacturing, the construction and installation of the wind power plant, the operation and maintenance activities, and other parallel activities such as engineering, consultancy, education, distribution network, and utilities as depicted in Fig. 6.
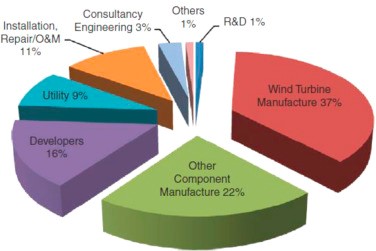
Fig. 6. Direct employment by type of company in the wind energy sector